HMDA Data
Mortgage Loan Stats
Mortgage Lending Data and Mortgage Application Totals
by Lender, City, State, and More
AllMortgageDetail.com provides powerful search tools and downloadable spreadsheets for aggregated HMDA data. Explore mortgage data by lender, city, county, state, metro area, and more. Designed for mortgage professionals, researchers, real estate analysts, regulators, policymakers, investors, and journalists, our platform delivers comprehensive insights for market analysis, compliance, and trend tracking. Unlock key mortgage data today!
Mortgage Loan Application Amounts by Loan Purpose
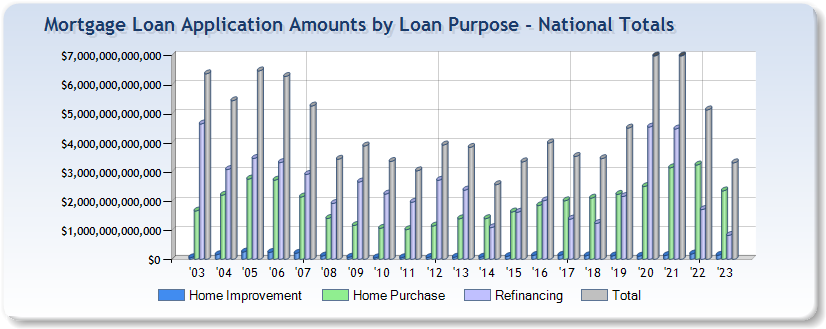
Explore national mortgage trends with our interactive data grid, showcasing total loan amounts by purpose for each year. Compare home improvement, home purchase, and refinancing volumes across decades to track market shifts. This valuable HMDA data helps mortgage professionals, analysts, and researchers gain insights into lending patterns and industry dynamics.
| Year | Home Improvement | Home Purchase | Refinancing | Total |
|---|---|---|---|---|
| 2003 | $58,142,407,000 | $1,665,300,366,000 | $4,661,923,190,000 | $6,385,365,963,000 |
| 2004 | $161,130,209,000 | $2,209,078,897,000 | $3,090,693,585,000 | $5,460,902,691,000 |
| 2005 | $251,008,318,000 | $2,762,751,074,000 | $3,472,824,190,000 | $6,486,583,582,000 |
| 2006 | $239,109,985,000 | $2,727,108,595,000 | $3,328,995,803,000 | $6,295,214,383,000 |
| 2007 | $209,256,206,000 | $2,147,638,464,000 | $2,922,288,616,000 | $5,279,183,286,000 |
| 2008 | $116,194,949,000 | $1,407,704,803,000 | $1,922,336,739,000 | $3,446,236,491,000 |
| 2009 | $73,426,585,000 | $1,166,427,575,000 | $2,662,355,908,000 | $3,902,210,068,000 |
| 2010 | $54,766,173,000 | $1,068,629,592,000 | $2,246,763,391,000 | $3,370,159,156,000 |
| 2011 | $58,759,110,000 | $1,023,717,029,000 | $1,965,578,208,000 | $3,048,054,347,000 |
| 2012 | $66,978,456,000 | $1,149,372,476,000 | $2,721,162,125,000 | $3,937,513,057,000 |
| 2013 | $74,193,149,000 | $1,396,667,024,000 | $2,384,257,034,000 | $3,855,117,207,000 |
| 2014 | $75,814,827,000 | $1,402,434,368,000 | $1,093,125,735,000 | $2,571,374,930,000 |
| 2015 | $101,915,080,000 | $1,633,245,684,000 | $1,621,342,219,000 | $3,356,502,983,000 |
| 2016 | $135,206,200,000 | $1,850,962,309,000 | $2,018,361,845,000 | $4,004,530,354,000 |
| 2017 | $140,430,292,000 | $2,016,148,093,000 | $1,386,169,223,000 | $3,542,747,608,000 |
| 2018 | $122,589,995,000 | $2,108,089,055,000 | $1,237,365,535,000 | $3,468,044,585,000 |
| 2019 | $118,572,755,000 | $2,236,279,660,000 | $2,164,412,115,000 | $4,519,264,530,000 |
| 2020 | $106,605,240,000 | $2,505,455,885,000 | $4,553,756,405,000 | $7,165,817,530,000 |
| 2021 | $131,615,690,000 | $3,152,109,455,000 | $4,488,134,135,000 | $7,771,859,280,000 |
| 2022 | $184,580,775,000 | $3,247,943,205,000 | $1,713,311,255,000 | $5,145,835,235,000 |
| 2023 | $140,619,105,000 | $2,357,699,975,000 | $823,837,980,000 | $3,322,157,060,000 |
Mortgage Loan Application Amounts by Loan Type
Analyze national mortgage trends with our comprehensive graph and data grid, detailing total loan amounts by type for each year. Compare conventional, FHA-insured, FSA/RHS, and VA-guaranteed loans to track lending shifts. This data helps professionals track government-backed versus conventional lending and understand market dynamics over time.
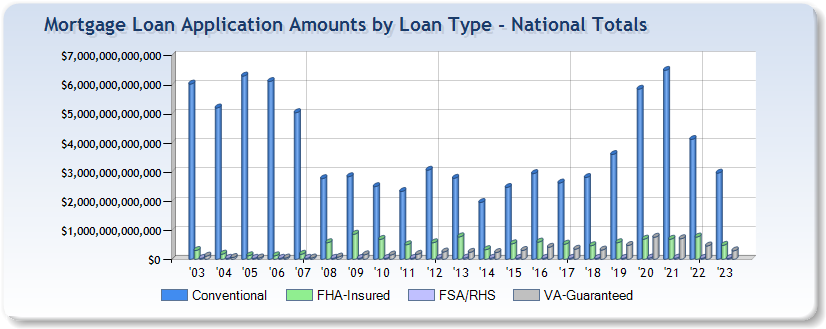
| Year | Conventional | FHA-insured | FSA/RHS | VA-guaranteed |
|---|---|---|---|---|
| 2003 | $6,034,139,176,000 | $304,489,424,000 | $4,481,342,000 | $112,401,875,000 |
| 2004 | $5,211,325,770,000 | $181,502,417,000 | $4,189,243,000 | $63,885,261,000 |
| 2005 | $6,309,164,175,000 | $124,730,672,000 | $4,144,454,000 | $48,544,281,000 |
| 2006 | $6,121,488,485,000 | $122,866,962,000 | $3,941,992,000 | $46,916,944,000 |
| 2007 | $5,049,106,555,000 | $175,661,784,000 | $5,594,074,000 | $48,820,873,000 |
| 2008 | $2,779,202,758,000 | $573,624,789,000 | $13,414,741,000 | $79,994,203,000 |
| 2009 | $2,845,590,059,000 | $865,826,708,000 | $33,634,247,000 | $157,159,054,000 |
| 2010 | $2,503,386,134,000 | $688,496,262,000 | $28,272,176,000 | $150,004,584,000 |
| 2011 | $2,335,163,205,000 | $502,786,386,000 | $36,044,520,000 | $174,060,236,000 |
| 2012 | $3,068,939,728,000 | $571,506,171,000 | $43,778,960,000 | $253,288,198,000 |
| 2013 | $2,789,120,631,000 | $775,467,935,000 | $46,787,494,000 | $243,741,147,000 |
| 2014 | $1,957,454,240,000 | $334,461,583,000 | $43,940,337,000 | $235,518,770,000 |
| 2015 | $2,475,607,499,000 | $535,707,199,000 | $37,848,952,000 | $307,339,333,000 |
| 2016 | $2,952,021,534,000 | $596,524,811,000 | $38,305,894,000 | $417,678,115,000 |
| 2017 | $2,628,618,865,000 | $524,274,311,000 | $39,081,502,000 | $350,772,930,000 |
| 2018 | $2,816,918,570,000 | $471,203,970,000 | $32,381,925,000 | $321,129,555,000 |
| 2019 | $3,608,464,395,000 | $573,645,220,000 | $31,981,880,000 | $479,329,210,000 |
| 2020 | $5,856,352,540,000 | $696,539,025,000 | $46,574,725,000 | $762,512,810,000 |
| 2021 | $6,503,477,395,000 | $694,578,895,000 | $42,590,140,000 | $710,924,790,000 |
| 2022 | $4,127,458,115,000 | $769,773,185,000 | $21,137,340,000 | $462,478,940,000 |
| 2023 | $2,967,837,460,000 | $484,177,430,000 | $12,917,415,000 | $294,021,220,000 |
Top 25 Counties by Mortgage Loan Application Count in 2023
Discover the top 25 counties and metro areas by mortgage loan application count in 2023 below with our dynamic, interactive grid. Each location is linked to a detailed page for deeper insights into lending trends, borrower activity, and market demand. Explore regional mortgage data and uncover key patterns shaping the housing market.
| County | Total Number of Mortgage Loan Applications | Total Mortgage Loan Application Amount | Average Mortgage Loan Application Amount | Average Applicant Income |
|---|---|---|---|---|
| Santa Clara County California |
34,747 | $29,763,695,000 | $856,000 | $313,000 |
| San Francisco County California |
24,376 | $21,753,025,000 | $892,000 | $355,000 |
| New York County New York |
19,111 | $26,213,230,000 | $1,372,000 | $573,000 |
| San Mateo County California |
17,887 | $17,508,425,000 | $979,000 | $352,000 |
| Marin County California |
9,963 | $8,726,400,000 | $875,000 | $349,000 |
| Monroe County Florida |
2,966 | $1,884,865,000 | $635,000 | $353,000 |
| Summit County Utah |
2,566 | $2,393,800,000 | $932,000 | $478,000 |
| Wasatch County Utah |
2,277 | $1,634,345,000 | $717,000 | $391,000 |
| Eagle County Colorado |
2,182 | $1,835,930,000 | $841,000 | $383,000 |
| Summit County Colorado |
1,983 | $1,225,455,000 | $617,000 | $346,000 |
| Teton County Wyoming |
1,159 | $1,611,925,000 | $1,390,000 | $553,000 |
| Routt County Colorado |
1,101 | $784,695,000 | $712,000 | $324,000 |
| Blaine County Idaho |
1,002 | $757,140,000 | $755,000 | $314,000 |
| Pitkin County Colorado |
982 | $2,090,180,000 | $2,128,000 | $635,000 |
| Dukes County Massachusetts |
981 | $1,015,785,000 | $1,035,000 | $459,000 |
| Nantucket County Massachusetts |
957 | $1,527,045,000 | $1,595,000 | $668,000 |
| Valley County Idaho |
888 | $438,260,000 | $493,000 | $292,000 |
| Mono County California |
640 | $321,890,000 | $502,000 | $384,000 |
| Madison County Montana |
526 | $1,147,960,000 | $2,182,000 | $575,000 |
| San Miguel County Colorado |
337 | $458,040,000 | $1,363,000 | $640,000 |
| Falls Church County Virginia |
304 | $182,210,000 | $599,000 | $323,000 |
| Rich County Utah |
281 | $113,985,000 | $405,000 | $292,000 |
| Ouray County Colorado |
194 | $75,500,000 | $389,000 | $316,000 |
| Roberts County South Dakota |
134 | $19,360,000 | $144,000 | $473,000 |
| Alpine County California |
77 | $35,855,000 | $465,000 | $308,000 |
Top 25 Metro Areas by Mortgage Loan Application Count in 2023
Explore the top 25 counties and metro areas by mortgage loan application count in 2023 with our interactive grid. Each location links to a detailed page with in-depth insights on lending trends, borrower activity, and market demand. Analyze regional mortgage data to identify key patterns shaping the housing market.
| Metro Area | Total Number of Mortgage Loan Applications | Total Mortgage Loan Application Amount | Average Mortgage Loan Application Amount | Average Applicant Income |
|---|---|---|---|---|
| LOS ANGELES-LONG BEACH-GLENDALE, CA | 188,126 | $118,664,345,000 | $2,887,000 | $211,000 |
| NEW YORK-JERSEY CITY-WHITE PLAINS, NY-NJ | 169,381 | $106,958,035,000 | $2,447,666 | $227,000 |
| DENVER-AURORA-LAKEWOOD, CO | 126,981 | $48,855,410,000 | $2,424,500 | $246,000 |
| SAN DIEGO-CARLSBAD, CA | 82,549 | $44,273,205,000 | $2,797,500 | $214,500 |
| MIAMI-MIAMI BEACH-KENDALL, FL | 78,994 | $34,861,645,000 | $7,923,500 | $212,000 |
| NASSAU COUNTY-SUFFOLK COUNTY, NY | 78,367 | $35,927,880,000 | $4,039,000 | $213,000 |
| OAKLAND-HAYWARD-BERKELEY, CA | 71,715 | $41,660,080,000 | $607,500 | $233,500 |
| ANAHEIM-SANTA ANA-IRVINE, CA | 65,643 | $39,605,930,000 | $899,000 | $224,000 |
| BOSTON, MA | 61,367 | $29,501,655,000 | $1,504,000 | $193,000 |
| SAN FRANCISCO-REDWOOD CITY-SOUTH SAN FRANCISCO, CA | 42,264 | $39,328,675,000 | $34,077,000 | $353,000 |
| WASHINGTON-BALTIMORE-ARLINGTON, DC | 36,693 | $14,712,725,000 | $40,951,500 | $184,000 |
| SAN JOSE-SUNNYVALE-SANTA CLARA, CA | 36,669 | $30,704,005,000 | $9,251,000 | $257,000 |
| BRIDGEPORT-STAMFORD-NORWALK, CT | 28,070 | $14,463,430,000 | $565,000 | $231,000 |
| PENSACOLA-FERRY PASS-BRENT, FL | 27,244 | $6,884,870,000 | $401,000 | $250,500 |
| NAPLES-IMMOKALEE-MARCO ISLAND, FL | 19,200 | $8,752,640,000 | $9,794,500 | $253,000 |
| BARNSTABLE TOWN, MA | 11,405 | $4,562,205,000 | $277,500 | $196,500 |
| LINCOLN, NE | 10,770 | $2,406,800,000 | $215,500 | $234,500 |
| SAN RAFAEL, CA | 9,963 | $8,726,400,000 | $875,000 | $349,000 |
| BOULDER, CO | 9,947 | $4,578,880,000 | $460,000 | $215,000 |
| SANTA MARIA-SANTA BARBARA, CA | 8,275 | $6,090,070,000 | $736,000 | $261,000 |
| OCEAN CITY, NJ | 6,256 | $2,712,060,000 | $433,000 | $273,000 |
| SANTA CRUZ-WATSONVILLE, CA | 4,839 | $2,729,510,000 | $564,000 | $240,000 |
| FLAGSTAFF, AZ | 4,207 | $1,582,875,000 | $376,000 | $191,000 |
| NAPA, CA | 4,141 | $2,704,865,000 | $653,000 | $264,000 |
| KAHULUI-WAILUKU-LAHAINA, HI | 3,955 | $2,271,675,000 | $574,000 | $244,000 |
Top 50 Mortgage Companies and Lenders by Loan Application Count in 2023
Explore the top 50 mortgage lenders in 2023 with our dynamic grid, ranking lenders by loan application volume. Click on each lender to access detailed insights into their market share, loan activity, and trends. Stay informed on the industry's leading lenders and how they shape the mortgage landscape.
| Mortgage Lender | Total Number of Mortgage Loan Applications | Total Dollar Amount of Mortgage Loan Applications | Average Mortgage Loan Application Amount | Average Applicant Income |
|---|---|---|---|---|
| United Wholesale Mortgage, Llc Plymouth, MI |
394,401 | $145,342,215,000 | $337,750 | $152,666 |
| Pennymac Loan Services, Llc Wilmington, DE |
315,830 | $99,465,980,000 | $290,750 | $125,500 |
| Bank Of America, National Association Charlotte, NC |
271,974 | $64,651,950,000 | $296,000 | $152,000 |
| Jpmorgan Chase Bank, National Association Columbus, OH |
245,494 | $183,997,280,000 | $743,333 | $205,800 |
| Discover Bank Greenwood, DE |
219,689 | $18,898,055,000 | $107,000 | $135,500 |
| U.S. Bank National Association Cincinnati, OH |
211,879 | $61,326,985,000 | $234,833 | $159,400 |
| Navy Federal Credit Union Vienna, VA |
173,415 | $34,747,235,000 | $196,500 | $132,200 |
| Newrez Llc Wilmington, DE |
164,592 | $47,853,450,000 | $246,200 | $115,000 |
| 21St Mortgage Corporation Wilmington, DE |
163,986 | $19,335,770,000 | $82,400 | $69,800 |
| Citizens Bank, National Association Providence, RI |
144,132 | $31,928,570,000 | $206,500 | $128,666 |
| Amerihome Mortgage Company, Llc Wilmington, DE |
143,525 | $43,074,725,000 | $277,500 | $129,666 |
| Crosscountry Mortgage, Llc Wilmington, DE |
140,554 | $47,497,300,000 | $242,833 | $120,400 |
| Guaranteed Rate, Inc. Wilmington, DE |
136,557 | $50,626,530,000 | $348,000 | $156,666 |
| Pnc Bank, National Association Wilmington, DE |
132,468 | $33,244,645,000 | $286,600 | $165,800 |
| Vanderbilt Mortgage And Finance, Inc. Knoxville, TN |
129,372 | $16,970,640,000 | $418,750 | $109,000 |
| Mortgage Research Center, Llc Saint Louis, MO |
125,293 | $37,201,255,000 | $287,333 | $104,666 |
| Truist Bank Charlotte, NC |
122,576 | $29,630,390,000 | $193,166 | $124,000 |
| Fairway Independent Mortgage Corporation Austin, TX |
121,226 | $37,936,580,000 | $265,333 | $114,666 |
| Wells Fargo Bank, National Association Sioux Falls, SD |
113,593 | $54,297,085,000 | $337,333 | $151,600 |
| Loandepot.Com, Llc Dover, DE |
110,461 | $34,781,235,000 | $314,333 | $115,000 |
| The Huntington National Bank Columbus, OH |
101,419 | $17,751,455,000 | $147,000 | $112,333 |
| Amerisave Mortgage Corporation Peachtree Corner, GA |
96,779 | $25,269,875,000 | $272,666 | $106,666 |
| Lakeview Loan Servicing, Llc Wilmington, DE |
93,298 | $22,660,560,000 | $229,800 | $101,000 |
| Dhi Mortgage Company, Ltd. Dallas, TX |
84,937 | $28,346,735,000 | $302,000 | $116,333 |
| Movement Mortgage, Llc Wilmington, DE |
84,315 | $27,312,125,000 | $302,750 | $133,250 |
| Planet Home Lending, Llc Wilmington, DE |
84,177 | $25,969,845,000 | $223,400 | $108,000 |
| Triad Financial Services, Inc. Jacksonville, FL |
81,816 | $9,419,105,000 | $98,000 | $69,500 |
| Cmg Mortgage, Inc. Sacramento, CA |
79,582 | $28,759,890,000 | $324,800 | $156,000 |
| Flagstar Bank, N.A. Hicksville, NY |
78,592 | $24,421,710,000 | $277,000 | $132,800 |
| Freedom Mortgage Corporation Mt Laurel, NJ |
76,364 | $24,921,640,000 | $317,666 | $111,333 |
| Regions Bank Birmingham, AL |
75,203 | $14,162,375,000 | $213,200 | $127,600 |
| New American Funding, Llc Dover, DE |
74,675 | $19,302,025,000 | $243,500 | $103,750 |
| Figure Lending Llc Wilmington, DE |
73,301 | $5,706,275,000 | $154,250 | $142,500 |
| Guild Mortgage Company Llc Glendale, CA |
73,084 | $21,805,920,000 | $314,750 | $120,000 |
| Lennar Mortgage, Llc North Palm Beach, FL |
65,807 | $24,550,535,000 | $345,250 | $169,000 |
| Nationstar Mortgage Llc Wilmington, DE |
63,431 | $16,231,495,000 | $226,800 | $110,200 |
| Td Bank, National Association Wilmington, DE |
62,083 | $19,662,345,000 | $350,666 | $180,500 |
| Fifth Third Bank, National Association Cincinnati, OH |
59,075 | $11,201,755,000 | $163,833 | $117,600 |
| State Employees' Raleigh, NC |
54,508 | $8,049,930,000 | $128,400 | $108,750 |
| Cardinal Financial Company, Limited Partnership Sacramento, PA |
51,011 | $14,453,805,000 | $260,250 | $110,500 |
| Third Federal Savings And Loan Association Of Cleveland Cleveland, OH |
48,675 | $7,487,605,000 | $177,000 | $149,400 |
| Phh Mortgage Corporation Mount Laurel, NJ |
47,348 | $14,717,870,000 | $259,400 | $74,750 |
| Citibank, National Association Sioux Falls, SD |
43,081 | $37,820,560,000 | $1,129,000 | $524,400 |
| Carrington Mortgage Services, Llc Wilmington, DE |
43,018 | $9,130,690,000 | $227,600 | $110,200 |
| Everett Financial, Inc. Austin, US |
42,249 | $13,094,945,000 | $269,833 | $139,800 |
| Village Capital & Investment Llc Dover, DE |
38,639 | $12,591,095,000 | $319,666 | $71,666 |
| Primelending, A Plainscapital Company Dallas, TX |
37,847 | $11,607,255,000 | $281,750 | $130,250 |
| Bmo Bank National Association Chicago, IL |
35,666 | $12,910,730,000 | $322,500 | $167,833 |
| Pentagon Federal Credit Union Mclean, VA |
34,186 | $8,073,950,000 | $225,600 | $156,000 |
| New Day Financial, Llc Dover, DE |
34,182 | $9,779,610,000 | $257,500 | $69,500 |